America’s birthday is just around the corner, and although associated by many with a barbeque in the backyard, festive fireworks and crowded parades, the 4th of July is much more than that. The date of signing the Declaration of Independence provides an occasion to recall the nation’s glorious journey through the years and to pay due respect to the country’s notable personalities and historic landmarks.
If you are planning to celebrate Independence Day with a trip somewhere in the US, we suggest that you choose a destination that really has something to tell you about the country. The best way to immerse yourself in history is to follow in the footsteps of those who shaped it with their acts of bravery and patriotism.
To commemorate this year’s Independence Day the team at DealsDaddy pulled data from the National Register of Historic Places in search of the US states with the richest history. We calculated the number of Historic Landmarks per 1,000 square miles for every US state and visualized the data on a color-coded map to identify the most landmark-dense states. We also calculated each state’s rate of Medal of Honor recipients per 100,000 residents based on data from the National Medal of Honor Museum. This way we found the states that have given the greatest number of brave military men and women to the country.

You may find the raw data we based this map on here:
States with the most Landmarks per 1,000 square miles
From tributes to indigenous people to important historical events, monuments all over the United States symbolize America’s diverse and complex history. Although the greatest number of historic landmarks are located in New York, the state only ranks 7th in terms of per square mile ratio. Rhode Island, Massachusetts, Connecticut, New Jersey, and Maryland round up the top 5 with RI’s landmark density being nearly twice that of MA.
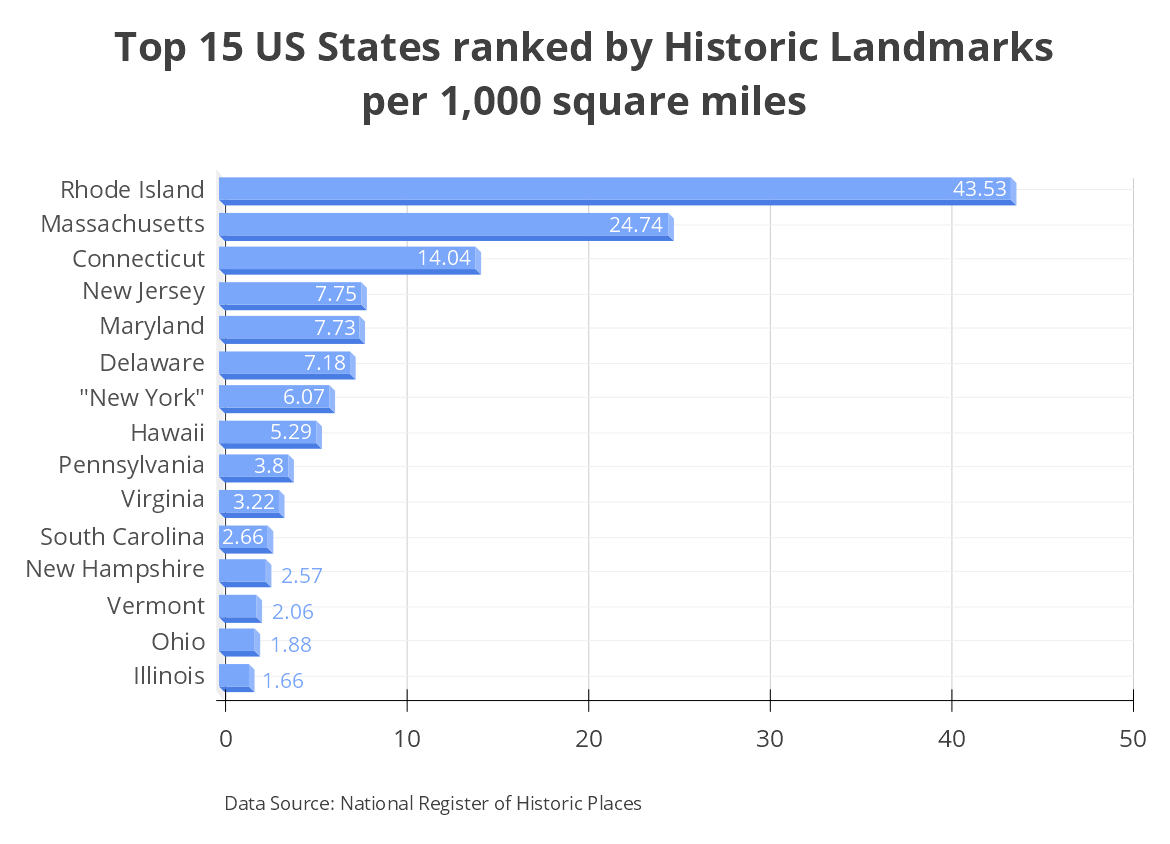
Rhode Island may not be the first state that comes to mind in terms of historical richness, but it is actually the state with the highest number of landmarks per square mile. According to the National Register of Historic Places database, RI is the home of 45 landmarks which amounts to 43.53 per 1,000 sq.mi. Fort Adams, The Breakers, and Ocean Drive Historic District are among the most popular ones.
Massachusetts occupies the second position in terms of both the total number of historic landmarks (193) and their per-square-mile ratio (24.74/1,000 sq. mi). Furthermore, 265 Medal of Honor recipients have entered service from Massachusetts, which positions it third in this regard, only behind New York and Pennsylvania.
With a territory of 4842.36 sq.mi. and accommodating 68 landmarks, Connecticut is in 3rd place for the highest landmark density in the US (14.04 per 1,000 sq.mi.). New Jersey and Maryland come in 4th and 5th with nearly the same per-square-mile ratios of 7.75 and 7.73 landmarks per 1,000 sq.mi., respectively.
States with the most Medal of Honor recipients
Determined by Congress and presented by the President of the US, the Medal of Honor is the highest award for men and women who have served in the U.S. Armed Forces since the Civil War. It was created in 1861 and has since been granted to 3,551 valiant individuals, many of whom sacrificed themselves for the sake of their country.

With 1,515 or 42.66% of all soldiers and other military personnel having earned the Medal of Honor during the Civil War (all from the Union forces who fought for the North), it comes as no surprise that New York (672), Pennsylvania (379), Massachusetts (265), Ohio (254), and Illinois (206) top the ranking when it comes to the number of award recipients.
We also decided to look at the Medal of Honor per capita ratio and found that it is again the northern US states that make up the Top 5. Vermont holds the first position with 7.42 award recipients per 100,000 residents, followed by Maine (4.76), Massachusetts (3.8), New York (3.42), and Pennsylvania (2.92).
Twenty-one states have produced the 46 presidents of the United States. The southern state of Virginia boasts the largest number of presidents born on its territory – 8, followed by Ohio 7, and New York 5.
Methodology
In order to determine which state has the highest landmark density, the team at DealsDaddy compared the 50 states based on the ratio of their land area, data retrieved from the US Census Bureau, and the number of historic places worthy of preservation verified by the National Register of Historic Places. As for the numbers related to the Medal of Honor recipients, we consulted the National Medal of Honor Museum and the WorldPopulationReview.
Raw Data
| State | Land Area (sq mi) | Number of historic
landmarks |
Historic landmarks per 1,000 sq miles |
| Rhode Island | 1,033.81 | 45 | 43.53 |
| Massachusetts | 7,800.06 | 193 | 24.74 |
| Connecticut | 4,842.36 | 68 | 14.04 |
| New Jersey | 7,354.22 | 57 | 7.75 |
| Maryland | 9,707.24 | 75 | 7.73 |
| Delaware | 1,948.54 | 14 | 7.18 |
| New York | 47,126.40 | 286 | 6.07 |
| Hawaii | 6,422.63 | 34 | 5.29 |
| Pennsylvania | 44,742.70 | 170 | 3.8 |
| Virginia | 39,490.09 | 127 | 3.22 |
| South Carolina | 30,060.70 | 80 | 2.66 |
| New Hampshire | 8,952.65 | 23 | 2.57 |
| Vermont | 9,216.66 | 19 | 2.06 |
| Ohio | 40,860.69 | 77 | 1.88 |
| Illinois | 55,518.93 | 92 | 1.66 |
| Maine | 30,842.92 | 47 | 1.52 |
| Louisiana | 43,203.90 | 60 | 1.39 |
| Indiana | 35,826.11 | 46 | 1.28 |
| California | 155,779.22 | 150 | 0.96 |
| Florida | 53,624.76 | 48 | 0.9 |
| Georgia | 57,513.49 | 51 | 0.89 |
| Mississippi | 46,923.27 | 41 | 0.87 |
| Wisconsin | 54,157.80 | 45 | 0.83 |
| Tennessee | 41,234.90 | 34 | 0.82 |
| North Carolina | 48,617.91 | 40 | 0.82 |
| Kentucky | 39,486.34 | 32 | 0.81 |
| Alabama | 50,645.33 | 40 | 0.79 |
| West Virginia | 24,038.21 | 19 | 0.79 |
| Michigan | 56,538.90 | 42 | 0.74 |
| Missouri | 68,741.52 | 40 | 0.58 |
| Iowa | 55,857.13 | 28 | 0.5 |
| Arkansas | 52,035.48 | 25 | 0.48 |
| Arizona | 113,594.08 | 48 | 0.42 |
| Washington | 66,455.52 | 26 | 0.39 |
| New Mexico | 121,298.15 | 45 | 0.37 |
| Minnesota | 79,626.74 | 28 | 0.35 |
| Kansas | 81,758.72 | 27 | 0.33 |
| Oklahoma | 68,594.92 | 22 | 0.32 |
| Wyoming | 97,093.14 | 30 | 0.31 |
| Nebraska | 76,824.17 | 22 | 0.29 |
| Colorado | 103,641.89 | 25 | 0.24 |
| South Dakota | 75,811.00 | 16 | 0.21 |
| Montana | 145,545.80 | 29 | 0.2 |
| Oregon | 95,988.01 | 19 | 0.2 |
| Texas | 261,231.71 | 48 | 0.18 |
| Utah | 82,169.62 | 14 | 0.17 |
| Idaho | 82,643.12 | 10 | 0.12 |
| North Dakota | 69,000.80 | 7 | 0.1 |
| Alaska | 570,640.95 | 52 | 0.09 |
| Nevada | 109,781.18 | 10 | 0.09 |